Corruption Perceptions Index 2013
In the interactive graph shown above, countries are scored from 0-100, with 0 being most corrupt and 100 being least corrupt. By hovering the mouse over a certain country, that country's score and ranking will be shown. (The lower the rank, the cleaner the country is perceived to be).
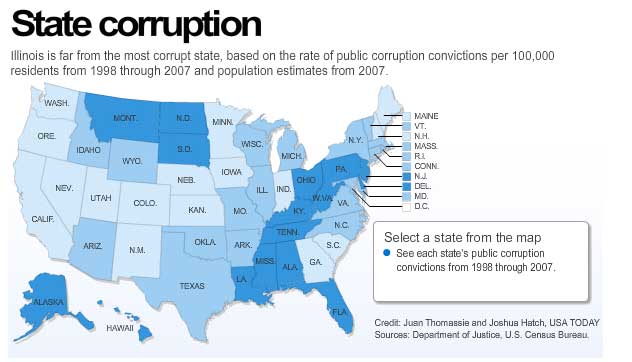
In order to select a state from the map and view its categorized state corruption, please click the button below.
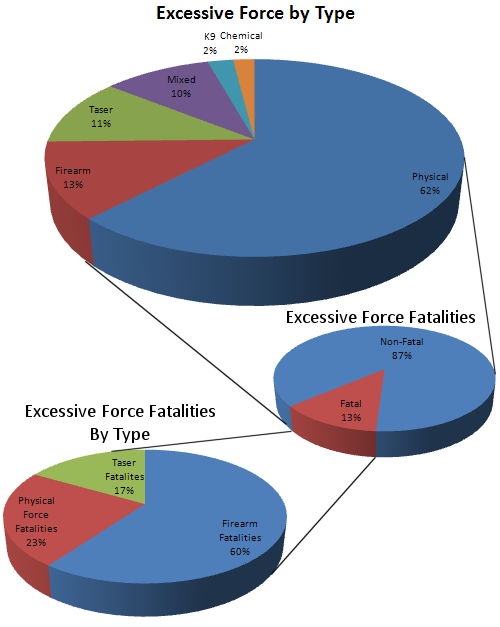
The pie chart above depicts examples of excessive force used by the police in the United States, found on an online source from the National Police Misconduct Report 2010.
